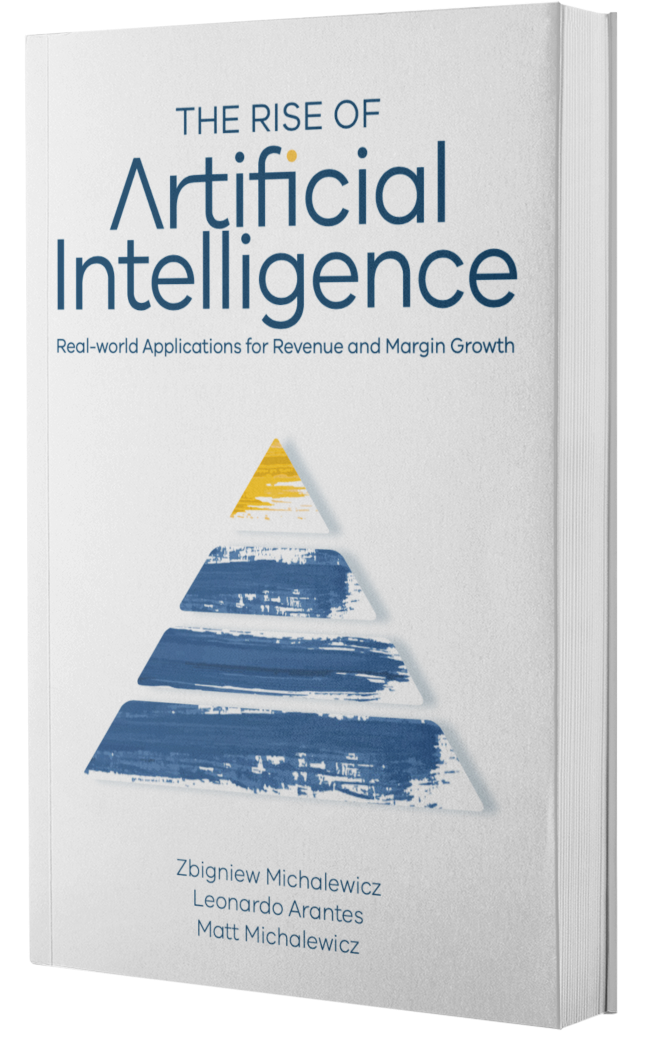
The Rise of Artificial Intelligence. Chapter 2: Artificial Intelligence as Applied to Decision Making
The Rise of Artificial Intelligence is available for purchase in hard copy from Amazon, Booktopia, Readings, Dymocks, and other booksellers, as well as in ebook form.
Chapter 2: Artificial Intelligence as Applied to Decision Making
This supplementary video to Chapter 2 of The Rise of Artificial Intelligence discusses the problem-to-decision pyramid, along with an explanation of each layer and in-depth examples. This video also discusses where Artificial Intelligence methods apply to the decision-making process, and demonstrates the application of AI for prediction and optimisation problems using examples from demand planning and trade promotion optimisation.
Contact us to request a soft copy of any other chapter of the book.
Transcript (reading time: 12:45 min)
[00:00:06]
Hi, this is Matt Michalewicz, and I'm one of the co-authors of The Rise of Artificial Intelligence, and this is a supplementary video to Chapter 2 of the book. In this video, we'll discuss the problem-to-decision workflow, we'll show where Artificial Intelligence fits in and we'll provide examples. The easiest way to visualise the Problem-to-Decision workflow is through a pyramid with Problem at the bottom and Decision at the top. In any pyramid, the most important layer is the foundation, which in this case is the Problem.
[00:00:36]
And that makes perfect sense, because without having a clear definition of the problem we're trying to solve, the remaining layers don't make any sense. We don't know what data to collect. We don't know how to aggregate it into information. We don't know what knowledge we need, and so on. Hence, everything begins with the problem itself. Also, as we progress up the layers from Data to Information to Knowledge, our ability to make higher quality decisions increases. Thereby, we're able to unlock more value through better decisions.
[00:01:10]
As a case in point, imagine that the only thing we have is the problem itself. There's no data, no information, no knowledge. And for that we could only rely on intuition and gut when making a decision, which would likely compromise the quality of the decision that we make. But as we collect data, develop information and knowledge and so on, our ability to improve the decision greatly increases. And with better decisions there's more value. So it all begins with the problem itself.
[00:01:42]
Common problem examples include building promotional plans, reducing inventory and working capital, creating production plans, predicting demand with a certain level of accuracy, restructuring sales organisations so that they can cover more customers with the same amount of people or less. And the list goes on. The list is actually endless and it's not important what the problem is. What's important is that we have a clear definition of the problem. Once we have that, we can progress to the next layer of the pyramid, which is Data.
[00:02:17]
Common examples of data include employee time sheets – when someone began work, stopped work, did they take lunch or did they work overtime – pay slips, shopping receipts. This person bought a six pack of Coopers Light. This person bought everything from Jack Daniel's to Maker's Mark. All of these are examples of data, discrete units, values, attributes that we can aggregate up and create information with. And that's what Information is. It's aggregated data, data that is summarised, visualised, or reported on.
[00:02:53]
It tells us what happened. Here's an example of a chart that shows revenue and margin and how it changes month by month. Over the course of the year, we could also run inventory reports that show us inventory on hand for a location or a time period. We could run reports on employee overtime by shift, by person, by location, by time period. All of these examples are of information which tell us what happened in the past. And if information tells us what happened, then knowledge tells us why it happened.
[00:03:28]
It's something we try to discover. As an example, this is information pertaining to sales of a product. It's a visualisation of sales on a chart, and across a six-week period, we can see how many of these products were sold in thousands of units. We can see that sales have gone from 10,000 units to less than 4 back to 10, less than 4, up to 18,000 and so on. So this tells us what happened, but it doesn't tell us why it happened.
[00:03:58]
And to discover knowledge, we need to conduct some deeper analysis of the data. We could, for example, overlay weather data with this sales data to see if there's a relationship between the two. And in this case, there is: as the temperature drops, sales drop as you can clearly see in this chart. This is a form of knowledge, informing us that product sales are influenced by the temperature, and potentially rainfall, in the region that it's being sold.
[00:04:31]
Knowledge is discovered through this kind of data analysis and exploration, and you can immediately see how it enables better decisions going forward. Other representations of knowledge are things like shopper baskets and how they change over time. Or if you are a store manager in a retail network, how the pricing of your products differ from pricing of similar stores in the same network. Here, it shows five products that are overpriced and five products that are underpriced in relation to similar stores in the network. We could also discover knowledge on when we over-serviced customers or under-serviced customers by analysing how many customers entered a store and how many staff were on duty at that time.
[00:05:22]
And from that analysis we could identify periods of time when there was a lot of customers in the store and few staff, and then periods of time when there were a lot of staff but very few customers. And this type of knowledge can be used to improve rostering and staffing decisions. By progressing up the pyramid and increasing the quality of our knowledge, we're therefore able to make better decisions. Just having random pieces of data is not very helpful when trying to reach a high quality decision.
[00:05:56]
But once that data is organised, aggregated, summarised, and then visualised as information, it becomes useful in the decision making process, and we can make better decisions. Once we add knowledge, which explains why things happen, we can make even better decisions. Now, once we reach the next layer of the pyramid - Prediction - we realise that there's actually a gap between Knowledge and what lies below, and Prediction and what lies above. The reason for this gap is that knowledge and everything before it represents the past, whereas prediction and what we end up doing, the decisions we make, represents the future.
[00:06:35]
Artificial Intelligence methods are ideally suited and applicable to the top of the pyramid, because that's where the value and complexity is. We can create value by making better decisions in the future, not by changing the decisions we made in the past. And predicting outcomes to complex scenarios or optimising various decisions usually involves a lot of complicated modelling and complexity. That is a very well-suited for Artificial Intelligence, bringing us to Prediction. Common prediction problems include demand forecasting within companies where we have historical sales of a product, and then we rely on a software application, or some predictive model, to create a prediction of what demand will be like in the future.
[00:07:25]
We can see here that even though sales have fallen quite dramatically over the last two weeks, the system is predicting a bounce back in sales. This could be attributable to the system looking at other data that's available, for example, what did we sell at this time of the year during previous years? It might also look at promotional data or pricing data or external data, such as weather or events to come up with a prediction. And then the future eventually becomes the present.
[00:07:56]
And we can see in this case that demand has jumped back to the level that was predicted originally by the model or the system. A more modern view of the same problem is here, where we can look at historical data for sales of a particular product and then have a system predict what sales are likely to be in the future, taking into account pricing, promotions and other external data and information. Promotional planning is also a business problem that has a very strong prediction component.
[00:08:30]
And with this example, we can illustrate the value that prediction brings in the pyramid to improve in our decision making. Here we can see a promotional plan for beer products for a period of time in some geography, and we can make changes to this plan by adding additional products on promotion or taking some products that have already been scheduled on promotion and removing them, like this one or that. Once we've made whatever changes we want, we can create a new scenario.
[00:09:10]
All of this introduces the need for predictive capabilities when making a decision. And instead of guessing how this plan will perform in the marketplace, we can actually move to an Artificial Intelligence-enabled function and ask the system to predict performance in the future. This is a very good example of Artificial Intelligence algorithms being used to take a complex plan and predict its performance in the marketplace. And that's what the output is: predicted performance, which we can view by business metrics that are of interest to us.
[00:09:51]
We can then can go back to the planning board, create another plan. Or, we could take the same one, and make further changes by adding more products to promotion or removing some products from promotion. We could then save this new plan again, and call it something different. And then we can go back to the prediction tab, and use Artificial Intelligence algorithms to help us understand how good these plans are, how they'll perform in the marketplace. What is the predicted outcome of these plans? And we can begin comparing them.
[00:10:40]
Now, what we see here is still a very manual process. Even though we have enabled very advanced capability to predict outcomes, we still have to manually create these plans and then manually compare them and try to find the best plan. And this is the difference between Prediction and Optimisation in the pyramid. Optimisation is the highest level just before a decision. It tries to look at all possible combinations, if possible, or some large number of combinations, and pick the one that gives us the best result.
[00:11:08]
So we can see that as we're moving through the pyramid, each layer is enabling a better decision, a higher quality decision. Having data on the problem is better than not having data. But having data summarised into information shows us what happened in the past. If we add knowledge, then we'll an understanding of why. If we add prediction capability, then we can create what-if plans or scenarios or plans, to understand whether our decisions are any good or not.
[00:11:38]
But optimisation adds the capability to automatically review a number of possibilities or scenarios and have Artificial Intelligence algorithms return back the best one, on whatever our objective is. If we go back, here's the optimisation tab. We can pick a scenario, tell the system that we want to maximise volume and then have the system do the work for us, instead of going through this process in a very manual way. So what would have taken us hours, days, weeks, months, potentially years of creating thousands and thousands of these scenarios and evaluating them, is done in a very short period of time and then presented back not only as a prediction, but also as a plan that can be executed in the marketplace.
[00:12:30]
Also a plan that shows us the differences between what we were doing, and what the system is proposing we should do. Here's the before and here's the after. This is what I proposed, and this is what the system is proposing. It also shows us what kind of financial gain can be achieved through each of these changes that the Artificial Intelligence algorithms came up with. So you can immediately see the value that this level of the pyramid adds to our decision making process.
[00:13:06]
Which brings us to the capstone of the pyramid, which is the Decision itself, and it's not always as straightforward as taking the output of an optimisation process and then implementing it as a decision, for the reason that there might be trade offs between objectives. When we make decisions, as a very classical example, there is a trade-off between working capital and inventory levels, and our customer service levels, measured through metrics such as delivery in full on time or fill rate, which means there's no one answer to this problem.
[00:13:40]
We can carry more inventory and satisfy more demand, or we can carry less inventory and have less working capital costs, but then we'll be more exposed to stock outs and lost sales. The important point is that each one of these dots on this curve is actually an optimal solution and requires an expert user, a supply chain manager or whoever is in charge of making the final decision, to select where they want to be on this curve for different customers, different geographic regions, and different products.
[00:14:13]
It also guarantees that the business doesn't make suboptimal decisions. For example, this red dot represents a decision that requires a lot of inventory and working capital, but has customer service levels that are not that great. So either this decision can be pushed down where we dramatically reduce the amount of inventory we need, but achieve the same customer service level. Or we can move right and keep the same working capital and inventory level, but achieve a much greater customer service level.
[00:14:49]
An example of this within a software environment, going back to the example that we were using, is here in the inventory tab. We can go to optimisation and we can type in, for example, the maximum working capital that we can possibly have and the minimum customer service level that we would be satisfied with. And we first need to select a scenario for which this will apply. And now we can see an Artificial Intelligence algorithm creating a trade-off curve for us, in this case trading off working capital against customer service levels at the bottom.
[00:15:27]
If we stop the process and scroll through these results, each of these trade-offs is a plan in and of itself that deals with replenishing certain stock in warehouses across the supply chain network. Each one of these is optimal. It just trades off one objective against another. For that reason, making the decision isn't that easy and requires some additional insight into potential trade-offs. Lastly is the concept of learning: just like human beings learn through past experience and decisions we made, software applications can do the same thing.
[00:16:06]
We can feedback the actual results of decisions made along with the new data and have the applications learn to be able to make more accurate predictions going forward and recommend better decisions. We can also look at the top of this pyramid as a decision optimisation system. These three levels represent the ability to predict, the ability to optimise a decision and then the ability to learn. And together they represent intelligent software systems that are generally based on Artificial Intelligence methods and can improve in quite dramatic ways the quality of our decisions.
Some of our Customers

















Some of our Recent Awards